The Poptics Campaign Analytics report provides a comprehensive overview of your campaigns’ performance at both the site and campaign levels. It allows you to track key metrics and identify trends that help optimize your popups for better conversions. Here’s how to interpret the analytics report:
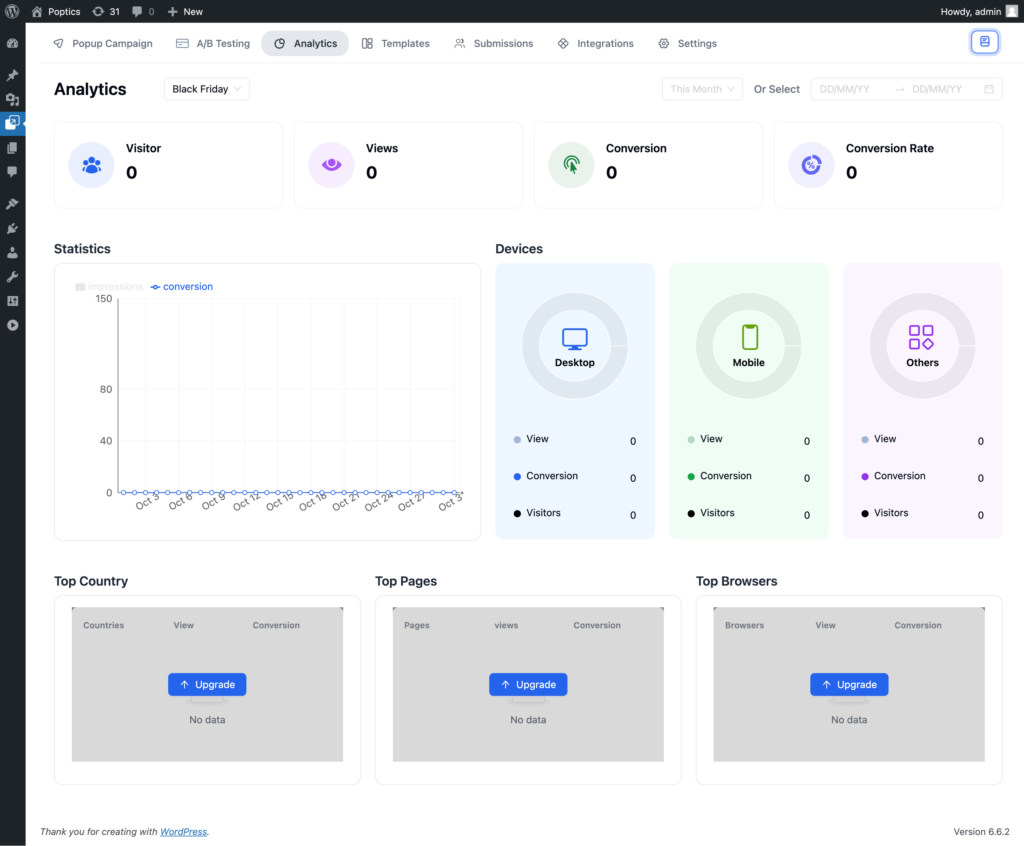
Filters
- Campaign-wise Filter: Filter the report based on specific campaigns to analyze individual performance.
- Date Range: Select a custom date range to view the performance during a specific time period.
Key Metrics
- Visitors: The number of unique visitors who viewed your campaign.
- Views: The total number of times your popup campaign was displayed.
- Conversions: The number of visitors who took action (such as signing up or clicking) after seeing your popup.
- Conversion Rate: The percentage of visitors who converted after viewing the popup.
Statistics
- Conversion vs. Impression: A visual chart showing the relationship between popup impressions and conversions over time, giving you insights into how well your campaign is performing.
Devices
- Device Breakdown: This section highlights the performance of your campaigns across different devices, such as desktop, mobile, and tablet. It helps you understand which devices your visitors use most.
Top Countries
- Geo-Targeting Insights: Displays the countries where your popup campaign receives the most traffic, helping you optimize for regional audiences.
Top Pages
- Page-Level Insights: This section shows the pages where your popups are performing best, allowing you to refine your targeting and focus on high-traffic areas.
Top Browsers
- Browser Breakdown: A breakdown of the browsers used by visitors to access your site, giving you insights into any browser-specific issues or trends.